Build your first application with Shiny
Introduction
Shiny is a package used to build interactive web application with R. The web application can be embedded in a rmarkdown document, a webpage, as a standalone or as a dashboard.
It’s really powerful and we can create powerful applications and dashboards quite quickly.
In this post I will walk through the basics of Shiny, how to build a simple apps, and introduce the concept of reactivity. I will just give the basics of user interface to get started and will explain more in another post about the user interface ( find the post here )
Minimum application
A shiny app needs at least the 4 following lines:
library(shiny)

ui <- fluidPage()

server <- function(input, output){}

shinyApp(ui, server)library(shiny): load shinyui <- fluidPage(): create the webpage, the user interface (UX)server <- function(input, output){}: the server part, where the business logic is implementedshinyApp(ui, server): create the app with the UX and server logic previously created.
Display text
It works, but the app doesn’t do anything. The easiest thing we can do is display a text.
You need to add the text to display in the fluidPage(), the text is passed as an argument to the function :
ui <- fluidPage(
  "Hi there, this is my text to display"
)
display a simple text
You can add different text, they will be display together:
ui <- fluidPage(
  "Hi there,",
  "this is my text to display"
)
Shiny uses a list of functions, called “tags”, to recreate HTML tags. For example, to add the text as a h1 title :
ui <- fluidPage(
  tags$h1("Hi there, this is my text to display")
)
display a text with a H1 tag
Syntax for the tags:
The most common html tags have wrapper functions, and can be used as describe above, by calling them as a function h1("title"), but for most of the tags, the syntax is tags$h1("title")
The most common html tags to format the text are:
- hierarchical headings: h1(), h2(), h3(), h4(), h5(), h6()
- emphasized (italic): em()
- bold font: strong()
- block of code: code()
The list of all available html tags can be found here
Add a plot - use of the server function
Now we know the basic to display something, but the goal is to work with data, and display our results. To understand how it works, we’re going to add a plot.
To add a plot, there are 2 steps :
- Create the plot: this is done in the
server()function- the object created in the server function must be built inside a render (here
renderPlot(), for a textrenderText()) - the object must be saved to a list
output$<outputId>
- the object created in the server function must be built inside a render (here
- Display the plot: this is done in the
fluidPage()function- create a placeholder for the output using its outputId
library(shiny)
library(palmerpenguins)

ui <- fluidPage(

  code("My first plot in a Shiny app :"),
  plotOutput(outputId = "penguin_plot")

)
server <- function(input, output){

  output$penguin_plot <- renderPlot({
    library(palmerpenguins)
    plot(penguins$bill_depth_mm, penguins$bill_length_mm, col = penguins$species)
  })

}

shinyApp(ui, server)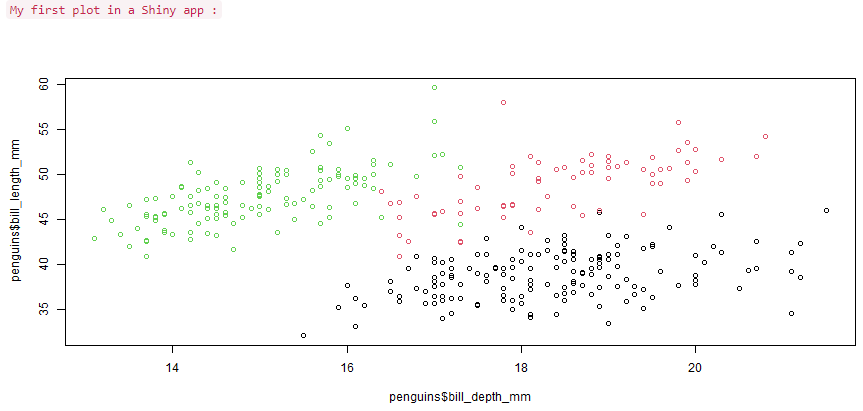
display a simple plot
Step by step :
- Render the plot in a
renderPlot()function in theserver()function - Assign the result to the output variable “penguin_plot”
output$penguin_plot <- renderPlot({ ... })in theserver()function - Display the plot
plotOutput(outputId = "penguin_plot"), just using the outputId (the variable name, not output$) in the fluidPage()function
Now that we build a first application that can display a text and a plot, it’s time to add some interactivity, and generate content based on input.
Interactive application
The purpose of building a web app is to be able to adjust parameters and obtain a different output based on the new inputs.
We’re going to build such an application, where the user can enter an input, and the application will provide an output based on that input.
The structure of the application is close to the previous one, there is only 2 steps to add:
- Ask the user to enter a value in the
fluidPage()UI - Read that value in the
server()to use it to adapt the output
Input
To ask the user to interact, we need to use an input functions. Input function looks like *Input(inputID, label, ...) where * is the type of the data, for example:
- textInput()
- numericInput()
- dateInput()
They have two mandatory parameters, and some additional parameters:
- inputId : the identifier of the input to access it in the
server() - label : the text that is displayed with the input in the UI
- … : additional parameters, depending on the type of input
numericInput() has 4 additional parameters, we can set a minimal and maximum value, an incremental step, and a width to display the input.
textInput() has 3 additional parameters, an initial value, the width of the input, and a placeholder to give an hint.
ui <- fluidPage(
  textInput(inputId = "name", label = "Enter your name", placeholder = "First name"),
  numericInput(inputId = "age", label = "How old are you?", value = 18, min = 18)
)
Access the input in the server() function
The value of the input can only be read in a render function. To access it, simply use the variable input$<inputId>. For example, to access the name and the age in a render*() function, use input$name and input$age.
server <- function(input, output){

  output$sentence <- renderText({
    paste("Hello", input$name, "You are", input$age, "years old.")
  })

}
In order to work, we need to add the display of the output in the fluidPage() function. The full code for this application is :
library(shiny)

ui <- fluidPage(
  textInput(inputId = "name", label = "Enter your name", placeholder = "First name"),
  numericInput(inputId = "age", label = "How old are you?", value = 18, min = 18),
  textOutput("sentence")
)

server <- function(input, output, session) {
  output$sentence <- renderText({
    paste("Hello", input$name, "you are", input$age, "years old.")
  })
}

shinyApp(ui, server)
Here is the full application:
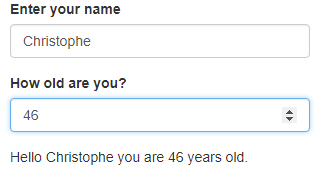
Let’s break down the application to understand how the interaction works:
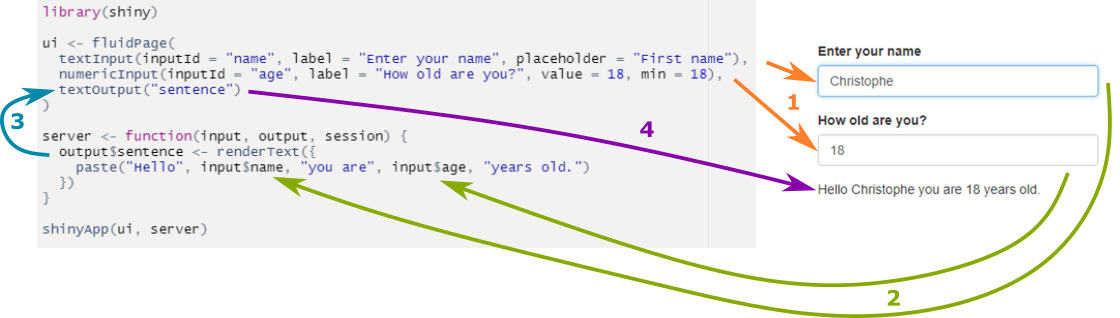
understanding interaction in shiny
- Display the input fields,
- Enter the values, trigger the render function that uses these inputs,
- The output$sentence is updated, which create a reaction in
textOuput()in thefluidPage() - The text is displayed.
Reactivity
Basics of reactivity
We’ve seen in the previous example that as soon as we change the input, the output react to the change and is updated.
Shiny uses reactive programming, if a modification is made to a variable, anything that uses this variable is re-evaluated.
inputs are always reactive variables, and they can be used only inside a reactive context.
The render* functions are reactive contexts, so we can use input$variable inside any render* function.
But the server() function is not, and the input variable can’t be accessed directly inside the server() function :
server <- function(input, output){
  print(input$name)
}
Error in .getReactiveEnvironment()$currentContext() : Operation not allowed without an active reactive context. (You tried to do something that can only be done from inside a reactive expression or observer.)
observe({…})
Fortunately, there are other reactive contexts. Observe is a reactive context and is used to access an input variable outside a render* function. If we go back to the previous example, the right way to print the variable would be :
server <- function(input, output){
  observe({
      print(input$bill_depth)
  })
}
Why would you do that ? This can be very useful for example to debug the code, and print the values of variable in the console.
reactive({…})
reactive is a another reactive context and is used to create a new reactive variable.
If you need to evaluate an intermediate variable, based on calculation, that will be used in multiple render* function, and avoid duplicating the calculation in every function.
Syntax :
To create a reactive variable :
new_variable <- reactive({
  input$variable * 2
})
To use the new variable, you need to add parenthesis as if you were calling a function:
observe({
  print( new_variable() )
})
Note : this is important to remember as it can be a source of error
- if you access the input variable, just call the input$<variable> (without parenthesis) inside a reactive context
- if you access a reactive variable created with reactive(), call variable() (with parenthesis) inside a reactive context
Let’s look at an example to illustrate this. Your application ask to select a range for the bill length of penguins, and display a table and a plot corresponding to the selected data.
Without reactive(), you need to filter the data in each render* function:
  output$penguin_plot <- renderPlot({
    data <- subset(penguins, bill_length_mm > input$bill_length[1] & bill_length_mm < input$bill_length[2])
    plot(data$bill_depth_mm, data$bill_length_mm, col = data$species)
  })

  output$penguin_table <- renderTable({
    data <- subset(penguins, bill_length_mm > input$bill_length[1] & bill_length_mm < input$bill_length[2])
    data
  })
In this example, it’s a simple selection of data, but we can see how it can impact the application speed if we need to duplicate complex calculation. Here the selection is done twice.
With reactive(), the selection is done only once, and the new variable containing only the result is then used in each render* function. The calculation are more efficient, and in case of a modification, there is no duplicated code, the modification is done only in the reactive function.
  data <- reactive({
      subset(penguins, bill_length_mm > input$bill_length[1] & bill_length_mm < input$bill_length[2])
  })

  output$penguin_plot <- renderPlot({
    plot(data()$bill_depth_mm, data()$bill_length_mm, col = data()$species)
  })

  output$penguin_table <- renderTable({
    data()
  })
Note the parenthesis to acccess the variable data, as it has been created with reactive().
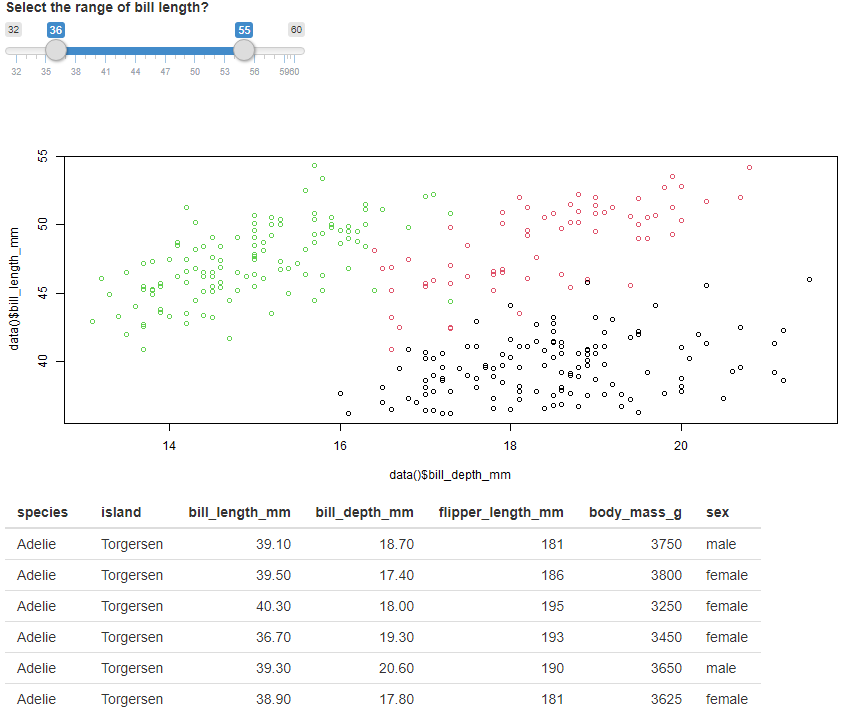
This is the full application :
library(shiny)
library(palmerpenguins)

ui <- fluidPage(
  sliderInput(inputId = "bill_length", label = "Select the range of bill length?", value = c(40,50), min = 32, max = 60),
  plotOutput("penguin_plot"),
  tableOutput("penguin_table")

)
server <- function(input, output){

  observe({
      print(input$bill_length)
  })

  data <- reactive({
      subset(penguins, bill_length_mm > input$bill_length[1] & bill_length_mm < input$bill_length[2])
  })

  output$penguin_plot <- renderPlot({
    plot(data()$bill_depth_mm, data()$bill_length_mm, col = data()$species)
  })

  output$penguin_table <- renderTable({
    data()
  })
}

shinyApp(ui, server)
which displays:
Layout
So far every time we add an element, they are displayed on top of each other. Shiny provide functions to improve the presentation and change the layout.
A common way of displaying a web application is to have a side bar with the inputs, and display the content in a main panel. Shiny has a function for this classic layout which is called sidebarLayout().
The sidebarLayout uses two arguments, the sidebarPanel() and the mainPanel(). You will place the code for the inputs in the sidebarPanel(), and the render output in the mainPanel().
You can display a title for the application by using titlePanel()
Here is the previous app using the sidebarLayout():
ui <- fluidPage(

  titlePanel("My analysis"),

  sidebarLayout(

    sidebarPanel(
      sliderInput(inputId = "bill_length", label = "Select the range of bill length?", value = c(40,50), min = 32, max = 60)
    ),

    mainPanel(
      plotOutput("penguin_plot"),
      tableOutput("penguin_table")
    )

  )

)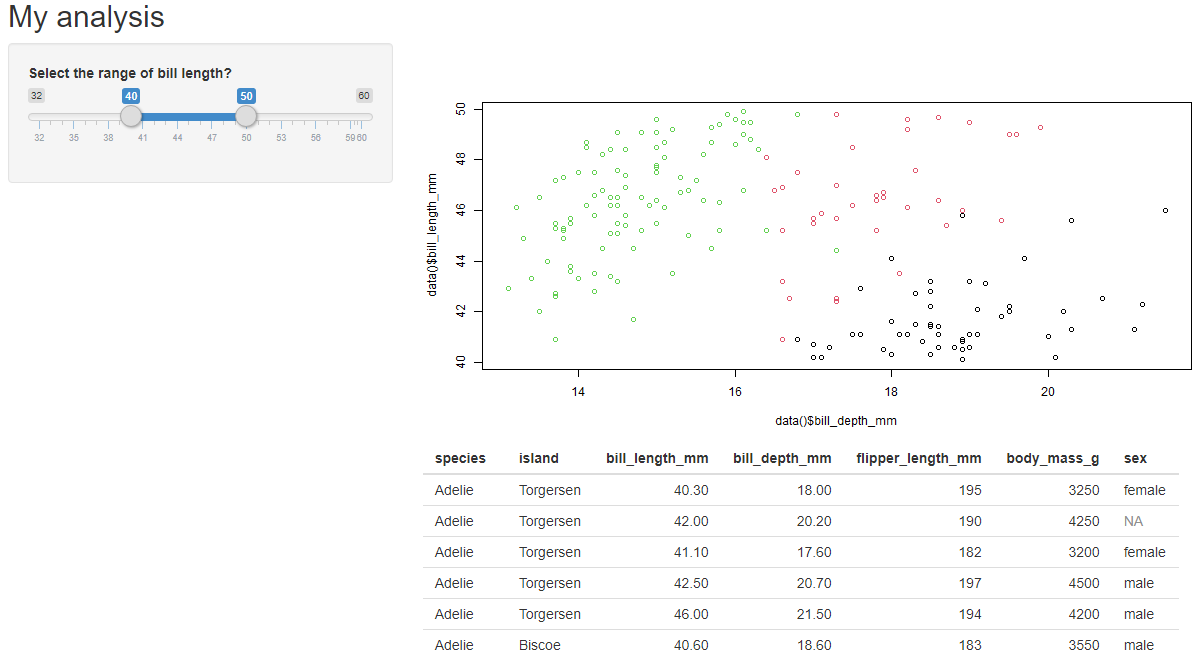
add a sidebar to the app
Using different tab
We can display the output in different tabs to make it easier to navigate and avoid too much things to display.
This is easily done using tabsetPanel() function to wrap all the panels code, and tabPanel() for each tab.
tabPanel() has two parameters :
- the name of the tab to display
- the code of the output
ui <- fluidPage(

  titlePanel("My analysis"),

  sidebarLayout(

    sidebarPanel(
      sliderInput(inputId = "bill_length", label = "Select the range of bill length?", value = c(40,50), min = 32, max = 60)
    ),

    mainPanel(
      tabsetPanel(
        tabPanel(title = "Plot",
                 plotOutput("penguin_plot")
                 ),
        tabPanel(title = "Table",
                 tableOutput("penguin_table")
                 )
      )
    )

  )

)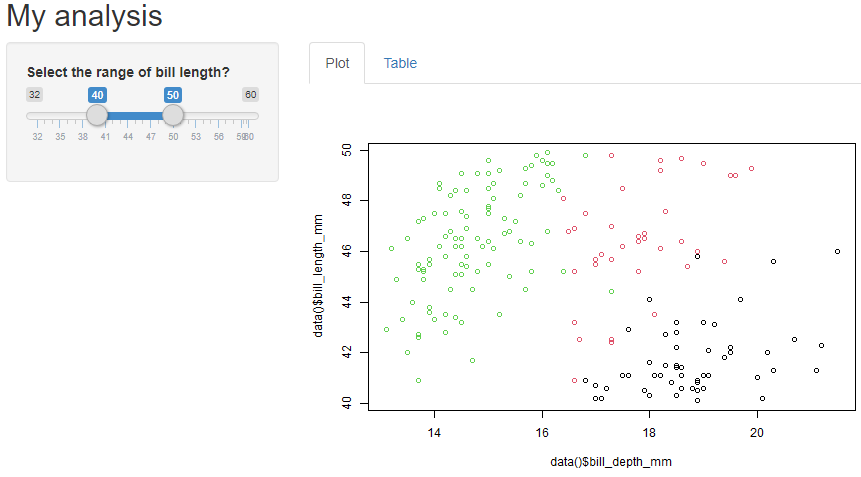
using tabs
File structure
So far for the purpose of this post, all the code was in a single file. It’s better to organise the application into at least 3 files :
- ui.R with the user interface
- server.R for the server logic
- app.R which brings the 2 together and start the application.
I wrote “at least 3 files” because you might want to use a file named “global.R”. This file is called once when launching the application, so you can execute code that your application will need (such as loading and manipulating the data) without adding complexity to your application’s files.
I will write another post dedicated to modules, which add another level of re-usability and organisation.
Conclusion
In this article I covered the development of a Shiny application to show the different key principles to get started. We saw the role of the server and ui in a shiny app, and learn to run a simple application. We added input to allow user’s interaction and talked about the concept of reactivity. Finally we improved the user interface by adding a sidebar and tabs.
It’s enough to get started and build real application. But of course there’s more to Shiny, and in the next article I will cover specifically the user interface to create more complex application and improve their look. You can find it here
Christophe Nicault
Information System Strategy
Digital Transformation
Data Science
I work on information system strategy, IT projects, and data science.